Choose a period
Open Analytics and choose 7, 30 or 90 days, or enter a custom date range. Comparisons use the immediately preceding period of the same length. Dashboard previews and documentation captures are excluded, so the report represents activity on public embeds.
Use Export CSV when the underlying period needs to be analyzed or shared outside Handled.
Read performance
The four headline measures answer different questions:
- Widget sessions count public browsing sessions in the selected period.
- Directions taps are the clearest standard signal that someone intends to visit.
- Visitor action rate shows the share of sessions reaching phone, email, website, custom-link or directions actions.
- Unmet demand is the share of completed searches that returned nothing.
Read search outcomes
Search outcomes separate searches that found at least one result from those that found nothing. A high no-result rate can indicate a coverage opportunity, a narrow default radius, incomplete categories or a search configuration that does not match visitor language.
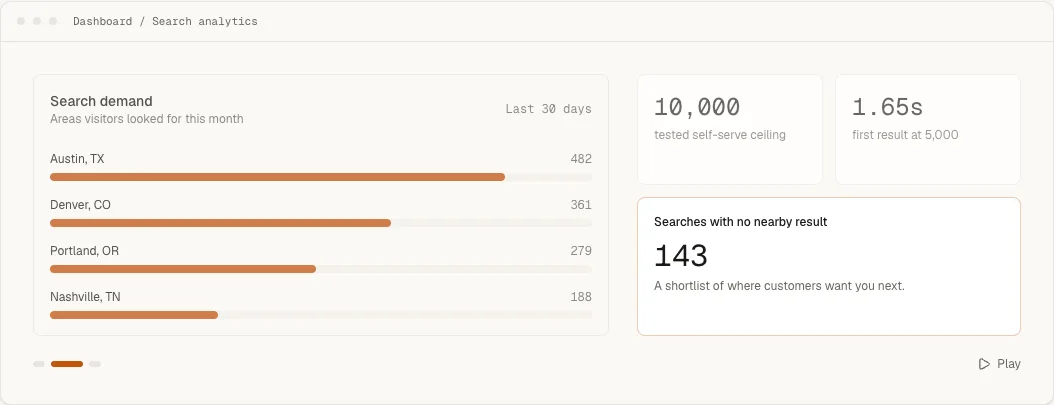
Search reach puts a distance on the same question: the average distance from a searched place to the nearest location, and the share of searches made more than 50 km from any location. A rising average with a steady no-result rate means the radius is doing its job while the network thins out at the edges. Popular filters lists the tags visitors most often had active when they narrowed the list, which is the order to put filter groups in.
Actions and top locations
The action breakdown separates directions, phone, website, email and custom links. Top locations can be sorted by opens, actions and directions for the chosen period.
The funnel reports each stage as a share of the stage immediately before it. This keeps a late-stage drop proportional to the visitors who actually reached that decision rather than comparing every step with the initial load.
See the complete locator analytics capability for the questions each report answers and the actions the widget records.